

Revealed – the capitalist network that runs the world
Vuoden 2011 sveitsiläisen tutkimuksen mukaan vain 737 yhtiötä hallitsee yhteensä 80 prosenttia kaikkien monikansallisten yritysten arvosta. Tästä yhtiöiden ryppäästä erottuu vielä 147 yhtiötä, jotka hallitsevat 40 prosenttia kaikkien monikansallisten firmojen arvosta. Tutkimukseen oli valittu yli 40 000 kansainvälistä yritystä, joiden joukossa omistamiset keskittyivät parille prosentille.
Koska yritykset omistavat toinen toisiaan, niin ne hallitsevat toistensa kautta itseään, tai päinvastoin.
Yllä olevasta linkistä löytyvä 50 huippu yrityksen lista viittaa syksyllä 2011 New Scientistissä julkaistuun sveitsiläisten tiedemiesten tutkimukseen pankkien ratkaisevasta hallinnasta maailman taloudessa.
Tutkimuksen mukaan pankit muodostavat kartelleja ja kontrolloivat globaalia taloutta.
Top-50:n yrityksen lista muodostuu tunnetuista nimistä pankki- ja sijoitusmaailmasta. Pankki- ja rahoitusjärjestelmä näyttää muodostavan yhden tehokkaasti toimivan kokonaisuuden.

The 1318 transnational corporations that form the core of the economy. Superconnected companies are red, very connected companies are yellow. The size of the dot represents revenue
PLoS One


THE $4.8 TRILLION GLOBAL INFORMATION TECHNOLOGY (IT) INDUSTRY
The global information technology industry surpassed $4.5 trillion in 2017, according to the research consultancy IDC. If growth expectations materialize in the year ahead, spending will eclipse the $4.8 trillion mark.
The United States is the largest tech market in the world, representing 31% of the total, or approximately $1.5 trillion for 2018. In the U.S., as well as in many other countries, the tech sector is one of the most significant contributors to GDP. See CompTIA’s Cyberstates report for more detailed economic impact analysis.
In the aggregate, the Asia-Pacific region, which encompasses Japan, China, Australia, India, and surrounding countries, accounts for one-third of the total. APEC has increased its share of the global IT pie, driven by the rise of countries such as China and India, and the slower growth rates experienced in parts of Europe and other markets. By 2032, China is projected to claim the mantle of world’s largest economy.

The vast majority of technology spending stems from purchases made by corporate or government entities. A smaller portion comes from household spending, including home-based businesses. With the blurring of work and personal life, especially in the small business space, along with the shadow IT phenomenon, it can be difficult to classify certain types of technology purchases as being solely business or solely consumer.
Breaking the IT market down into its components, the traditional categories of hardware, software and services account for 53% of the total. The other core category, telecom services, accounts for 30%. The remaining 17% covers various emerging technologies that either don’t fit into one of the traditional buckets or span multiple categories, which is the case for many emerging as-a-service solutions that include elements of hardware, software, and service (e.g. IoT offerings).
Energy Management
worldwide
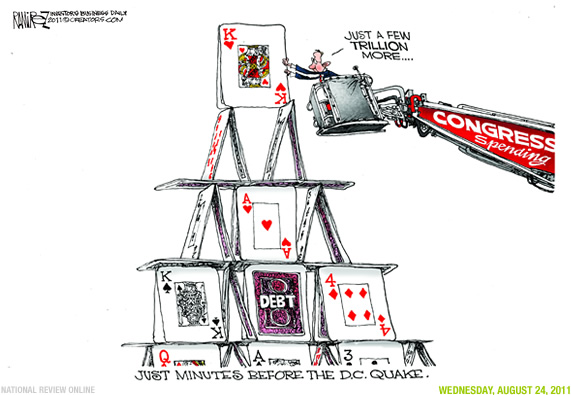
MILITARY – INDUSTRIAL COMPLEX
Global military spending remains high at $1.7 trillion

Tukholman rauhantutkimusinstituutti Siprin mukaan vuonna 2016 maailman vuotuiset sotilasmenot kasvoivat jo 1686 miljardiin Yhdysvaltain dollariin. Sotilasmenot ja asevarustelu verottavat valtioiden mahdollisuuksia puttua konfliktien ja väkivallan taustalla vaikuttaviin juurisyihin, kuten ilmastonmuutokseen ja köyhyyteen.
Yhdysvaltain puolustusvoimien uusi, valtava budjettiesitys on mennyt heittämällä läpi senaatissa keskiviikkona, kertoo AFP.
Budjetti lisää puolustusvoimien rahoitusta noin 100 miljardilla dollarilla nostaen sen 716 miljardiin dollariin.
Uusi budjetti lisää rahoitusta ulkomailla tapahtuviin operaatioihin 69 miljardilla dollarilla, antaa 2,6 prosentin palkankorotuksen armeijan työntekijöille ja sijoittaa kymmeniä miljardeja esimerkiksi laivaston ja ohjuspuolustusjärjestelmän uudistamiseen.
Esitys osoittaa myös 65 miljoonaa dollaria Yhdysvaltain ydinasearsenaalin uudistamiseen.
Lisäksi esitys antaa hallinnolle luvan joustaa pakotteissa, jotka estäisivät aseiden myynnin maihin, jotka käyttävät myös Venäjän kehittelemiä aseita ja teknologiaa. Esitys kuitenkin kieltää uuden suihkuhävittäjäkoneen myymisen Turkkiin, ennen kuin varmistuu, että Nato-maa ei ole ostamassa venäläistä ilmantorjuntajärjestelmää.
The 15 countries with the highest military spending worldwide in 2017 (in billion U.S. dollars)
https://areena.yle.fi/1-4240154?seek=657
Global Pharmaceutical Industry ( BIG PHARMA) – Statistics & Facts
The pharmaceutical industry is responsible for the development, production and marketing of medications. Thus, its immense importance as a global sector is inarguable. In 2014, total pharmaceutical revenues worldwide had exceeded one trillion U.S. dollars for the first time. North America is responsible for the largest portion of these revenues, due to the leading role of the U.S. pharmaceutical industry. However, as in many other industries, the Chinese pharmaceutical sector has shown the highest growth rates over previous years.
Imagine an industry that generates higher profit margins than any other and is no stranger to multi-billion dollar fines for malpractice.
In fact, the industry described above is responsible for the development of medicines to save lives and alleviate suffering, not the generation of profit for its own sake.
Stripping out the one-off $10bn (£6.2bn) the company made from spinning off its animal health business leaves a margin of 24%, still pretty spectacular by any standard.
Value of the global entertainment and media market from 2011 to 2021 (in trillion U.S. dollars)
In 2021, the market is expected to reach a worth of 2.2 trillion U.S. dollars. In the United States the entertainment and media market was worth 573.57 billion U.S. dollars in 2014 and is expected to grow to over 720 billion U.S. dollars by 2020.
Total global E&M revenue will see a 4.4% CAGR rise over the five year forecast period through 2022, reaching US$2.4 trillion in that year, from US$1.9 trillion in 2017. This is marginally up on last year’s predictions of a 4.2% CAGR, but is predicated on renewed bullishness in worldwide Internet access spend. https://www.pwc.com/gx/en/industries/tmt/media/outlook/segment-findings.html
Food & Beverages
worldwide
User (2018)+7.3% yoy 1,044.8
Jaakobin kirje:
” 5:1 Kuulkaa nyt, te rikkaat: itkekää ja vaikeroikaa sitä kurjuutta, joka on teille tulossa.
5:2 Teidän rikkautenne on mädännyt, ja teidän vaatteenne ovat koin syömät;
5:3 teidän kultanne ja hopeanne on ruostunut, ja niiden ruoste on oleva todistuksena teitä vastaan ja syövä teidän lihanne niinkuin tuli. Te olette koonneet aarteita viimeisinä päivinä.
5:4 Katso, työmiesten palkka, jonka te vainioittenne niittäjiltä olette pidättäneet, huutaa, ja leikkuumiesten valitukset ovat tulleet Herran Sebaotin korviin.
5:5 Te olette herkutelleet maan päällä ja hekumoineet, te olette sydäntänne syötelleet teurastuspäivänä.
5:6 Vanhurskaan te olette tuominneet ja tappaneet; hän ei vastusta teitä.
5:7 Niin olkaa kärsivällisiä, veljet, Herran tulemukseen asti. Katso, peltomies odottaa maan kallista hedelmää, kärsivällisesti sitä vartoen, kunnes saa syksyisen sateen ja keväisen.
5:8 Olkaa tekin kärsivällisiä, vahvistakaa sydämenne, sillä Herran tulemus on lähellä.”
